TL;DR — 5-Point Quick Summary
- Logistics teams generate mountains of data, but clarity comes from separating decision-making metrics from background noise.
- Transit time, cost per shipment, on-time delivery, surcharge patterns, and capacity utilization form the foundation for understanding network health.
- Signals tied to tracking clarity, delivery exceptions, and return timing often show stress in the operation before it appears in cost reports.
- Metrics such as claim recovery, first-scan latency, and carton utilization frequently expose hidden leakage and process constraints.
- Metrics create value when they guide concrete actions, from carrier allocation and workflow adjustments to more informed contract discussions.
If you lead a logistics or fulfillment operation today, you live with constant pressure to understand what’s happening inside your network. Service expectations shift. Labor stays tight. Carrier costs rise. Delivery windows narrow.
You already know data matters. The harder part is deciding which numbers deserve your attention and which ones don’t.
Not dashboard clutter or endless charts. A focused set of metrics that show where the operation holds steady, where margin slips, and where small changes carry weight.
This article walks through the logistics metrics that support clearer decisions, steadier execution, and stronger day-to-day control, without adding friction to carrier relationships.
Separating logistics metrics from noise
Carrier data arrives in many formats, shaped by different systems and reporting standards. Each stream makes sense on its own, but comparisons become difficult once you zoom out to view the network as a whole. Even accurate data can feel fragmented when it lives in separate portals.
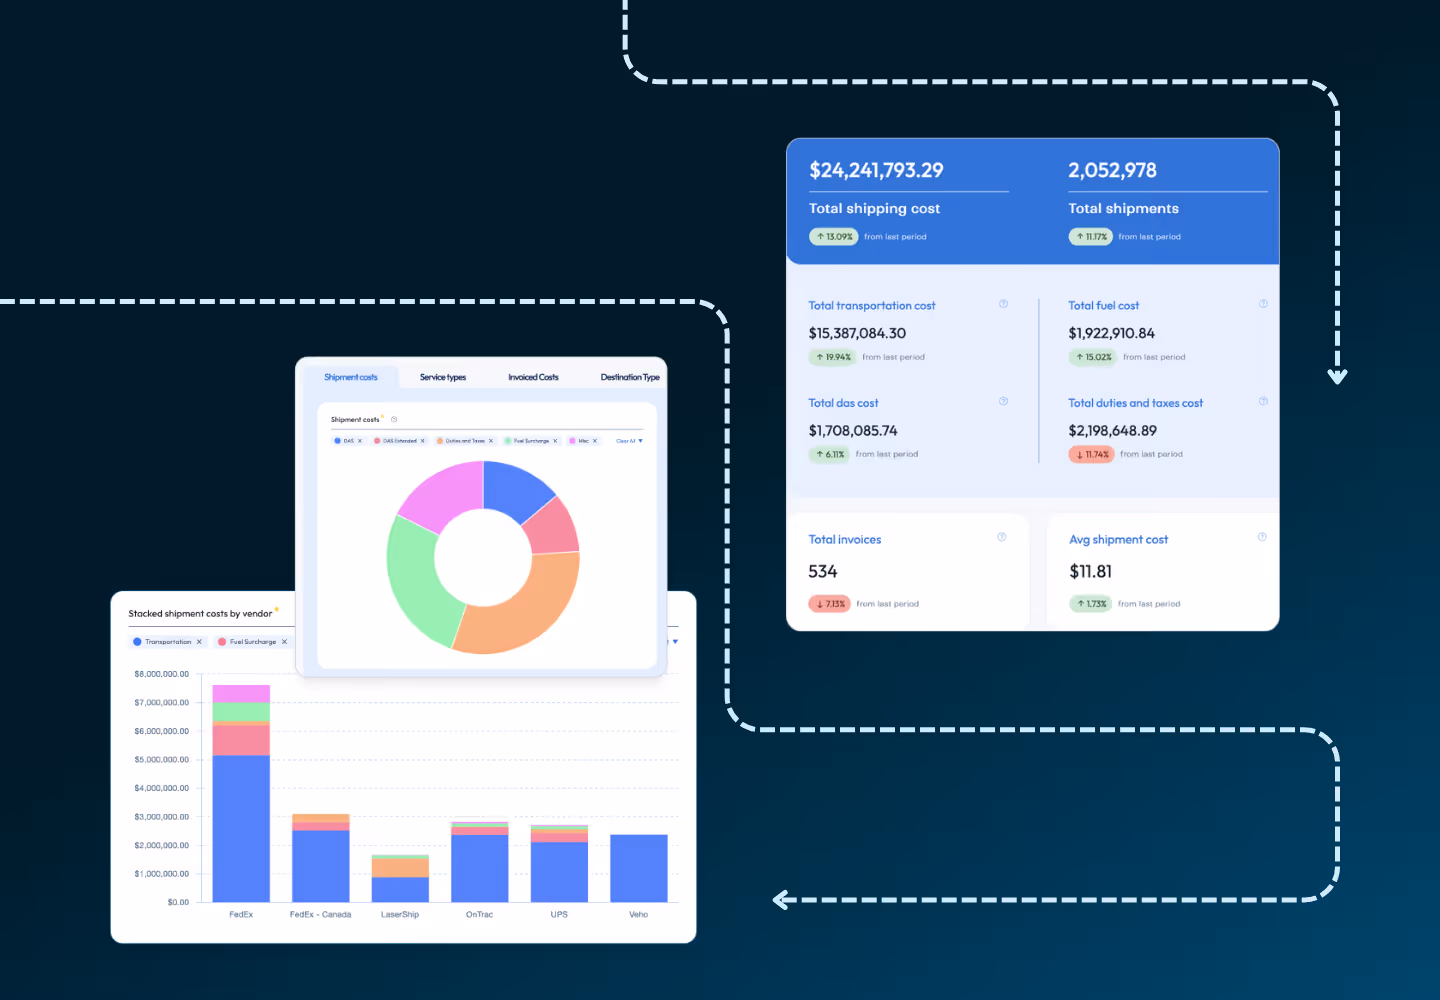
Consolidation changes the picture entirely. Normalized data reveals patterns that were easy to miss before. Cost, performance, surcharges, and lane behavior start to tell a coherent story instead of competing ones. ShipWise Intelligence brings these elements into a unified view so teams can evaluate the network as a system rather than a collection of disconnected parts.
From that point on, decisions rely less on instinct and more on evidence that holds up across the operation. With consolidated insights, teams can answer practical questions such as:
- Which lanes are slowing down during specific weeks or seasons?
- Where are surcharges rising faster than expected?
- Which services stay consistent when volume spikes?
- How do costs shift when volume moves between zones or service levels?
Aggregated metrics reveal how the network behaves as a whole, giving teams confidence without placing unnecessary pressure on any carrier or group.
Core logistics metrics to track
Logistics metrics fall into a few categories that involve speed, cost, accuracy, and reliability. These four areas influence everything from fulfillment labor to customer satisfaction. Viewed together, they provide a grounded picture of operational health.
Transit time performance
Transit time reflects how long shipments actually take compared to expectations. Shifts here often signal changes upstream or downstream before they show up elsewhere.
Operations teams usually feel these shifts early. Support volume rises. Late deliveries stack up. Overtime creeps into weekends. Looking at transit time by carrier, service, and zone surfaces these issues early, before they spread across the operation. Real-time tracking and delay notifications surface risk while there’s still time to respond.
Cost per shipment
This metric is central for both finance and operations. It's shaped by carrier rates, dimensional weight, packaging choices, zone distribution, and accessorial fees. When cost per shipment rises, it isn't always clear why, which leads to long meetings and second-guessing.
Automated invoice auditing inside ShipWise surfaces hidden surcharges, billing discrepancies, and repeat fees that are easy to miss manually. The earlier you catch these trends, the easier it is to protect margins.
On-time delivery rate
On-time delivery gives you a clean signal about reliability. Even small dips can create downstream strain: support tickets, refunds, and client escalations. What operations leaders want most is context. Why did the rate dip? Was it the weather? A specific lane? A service level?
Benchmarking across carriers and zones in ShipWise helps you understand performance shifts quickly. This allows you to make informed routing decisions without assuming blame on any carrier.
Surcharge frequency
Fuel fees, residential surcharges, address corrections, and Saturday delivery all add up faster than almost any other cost. They're not always avoidable, but they are trackable.
Operations teams who track surcharge patterns often discover that the issue isn't the carrier but inconsistent address data, packaging choices, or internal workflows. Address validation and cartonization inside ShipWise help reduce these fees before they occur.
Capacity utilization
This metric helps you understand whether your fulfillment centers, labor, and shipping lanes are running at healthy load levels. It's the logistics equivalent of checking the oil in your car.
Executives rely on capacity utilization to plan staffing, negotiate contracts, and decide when it's time to diversify carriers or open new shipping locations. ShipWise supports multi-location logic and routing to distribute volume more intelligently across regions.
Customer experience signals
Customer experience metrics give logistics leaders a clearer view of how delivery performance shows up for customers day to day. They help explain shifts in support volume, rising order-status questions, and changes in post-purchase confidence. These signals connect operational decisions to how customers actually experience the journey.
Tracking visibility rate
This measures how many shipments have clean, consistent updates. When visibility drops, stress goes up on your team and on your customers. Branded tracking inside ShipWise ensures tracking stays consistent, reliable, and easy to follow.
Delivery exceptions
Lost, damaged, or delayed shipments aren't just operational headaches. They represent real customer friction. Exception trends help you understand which lanes or products need new handling rules, packaging types, or routing logic.
Return processing time
Return speed affects both customer confidence and warehouse flow. Integrated return labels make it easier to process returns as they happen, without carrying upfront costs for unused labels. This keeps inventory moving while giving teams clearer visibility into reverse logistics.
Overlooked metrics with outsized impact
Not all metrics are obvious. Some sit quietly in the background but carry enormous weight in performance and cost.
Claim recovery rate
If you're not measuring refund recovery, you're losing money. Automatic auditing and claim submission in ShipWise helps teams capture dollars that often slip through the cracks.
First-scan latency
This tells you how long it takes for a carrier to register the package after pickup. A slower first scan creates downstream confusion, even if the delivery ends up on time.
Carton utilization
Packing decisions influence cost, speed, and damage rates. Carton utilization reflects how efficiently space is used. Better packing isn’t a preference. It’s an operational strategy. Cartonization reduces wasted space and minimizes dimensional weight exposure.
Turning logistics metrics into action
Metrics aren’t meant to be reviewed in isolation. Their value shows up when they shape action.
Executives and operations leaders typically use logistics metrics to make decisions in three key areas.
Improving carrier allocation
Teams look at delay patterns, lane performance, surcharge trends, and cost per shipment. The goal is to distribute volume in a way that supports consistent performance without putting pressure on any one carrier.
Real-time intelligence supports cost modeling, performance comparison, and service-mix adjustments using aggregated data rather than isolated incidents, keeping carrier discussions grounded and constructive.
Strengthening internal workflows
Metrics often reveal that operational problems aren't happening on the dock. They're happening earlier in the process. Bad addresses, poor carton selection, slow pick-pack cycles, and fragmented systems are frequent root causes.
Centralized order data, automated routing, and reduced manual decision-making help remove these pressure points before they compound.
Supporting smarter contract negotiations
Contract conversations become more productive when grounded in lane-level data. Clear performance history sets realistic expectations, supports constructive dialogue, and strengthens long-term partnerships.
Normalized reporting keeps these discussions focused on shared outcomes rather than isolated data points.
How clear metrics shape daily operations
Clear metrics change how work feels across a logistics operation. Readable performance signals shape daily rhythm. Warehouse teams understand pacing. Support teams explain delays without guessing. Stakeholders see control instead of reaction.
Normalized data, automated auditing, and real-time performance tracking surface issues early, whether tied to accessorials, slow lanes, or scan delays. Over time, that visibility becomes part of how the operation runs.
Staffing adjustments happen sooner. Routing questions decrease. Decisions feel steadier because the data behind them is consistent and already vetted.
In fast-moving environments, that steadiness becomes an advantage. It helps teams stay level during volume spikes or shifting expectations and gives every department clearer footing to do its best work.
Final thoughts
Strong logistics operations don’t rely on instinct or spreadsheets alone. They rely on visibility. Metrics make that visibility possible.
Tracking the right metrics brings control to costs, carrier relationships, fulfillment flow, and customer experience. Pairing those metrics with automation across rate shopping, cartonization, tracking, auditing, and routing creates an operation that scales with less stress and more confidence.
If you want a clearer view of your logistics data, ShipWise Intelligence and the full ShipWise platform were built for exactly that.


.svg)
.svg)
.svg)

.avif)

.avif)