Every shipment creates a trail of data containing rates, zones, delivery times, dimensions, and surcharges. These details reveal how your logistics network is performing, but for many businesses, they live in separate systems. Orders sit in one place, carrier invoices in another, and tracking updates are scattered across different portals. Without a unified view, it’s difficult to understand what’s driving your costs or why certain shipments run into delays.
Shipping data analytics solves this by bringing everything together. When shipment, tracking, and billing information are connected, patterns become easier to spot. You can see how different carriers perform, where spend is rising, and which parts of your network offer the biggest opportunities for improvement.
What shipping data analytics involves
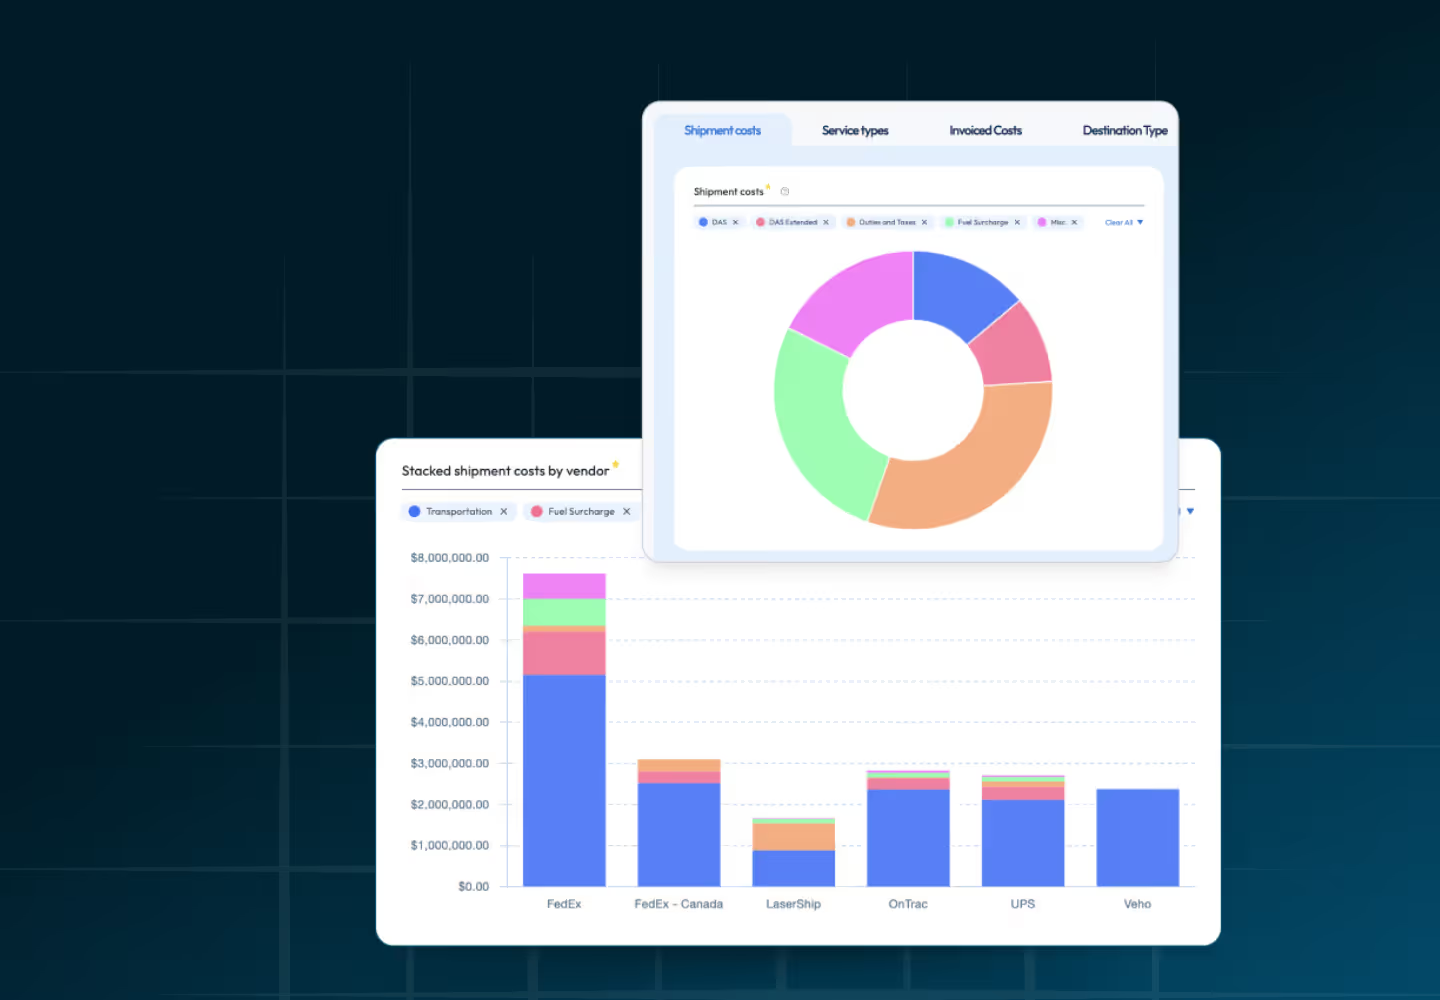
Typically speaking, shipping data analytics combines information from three main sources, including shipment files, tracking updates, and carrier invoices. Each one sheds light on a different part of the shipping journey. Shipment data shows what you sent and how it was packed. Tracking data reveals the route the package took once it left your facility. Invoice data shows what you were charged and whether those charges match your expectations.
Connecting disconnected systems
When these three types of data are separated, the picture is incomplete. Once they are analyzed together, it becomes easier to understand questions that are difficult to answer manually. You can see which services actually meet their delivery promises, which zones create repeat delays, and where your rates or discounts may not be applied correctly.
Parcel analytics vs. freight analytics
Parcel analytics and freight analytics serve different needs in the shipping industry. Parcel analytics focuses on small-package shipping, where costs are shaped by zones, DIM weight, surcharges, and delivery speed. These insights help teams catch issues at the package level, like repeated delays or rising accessorials.
Freight analytics looks at larger, heavier shipments such as LTL and FTL, and focuses on freight class accuracy, mode selection, lane performance, and total landed cost. Parcel data is more granular, while freight data is more strategic. Together, they give a complete view of your distribution network.
What questions analytics should help answer
You don’t need hundreds of KPIs to improve your shipping performance. A few focused questions reveal most of what you need to know:
- Which carriers and services offer the best balance of cost and delivery speed?
- Where do delays or service failures happen most often?
- Which surcharges appear repeatedly, and what triggers them?
- Are there lanes where ground already meets two-day delivery expectations?
These types of questions help you identify your true cost drivers and understand how your network performs day-to-day.
Variances in carrier data quality
Not all carriers provide the same depth, frequency, or structure of shipping data. Some limit access to certain tracking events, others offer inconsistent scan patterns, and many use unique naming conventions that make cross-carrier comparisons difficult.
These differences matter. When one carrier provides detailed milestone scans and another provides only a handful of events, the performance picture can become distorted unless the data is normalized and analyzed together.
Clean and comparable shipping data
Before analyzing performance, the data must be consistent. Carriers often use different terms for similar services, different formats for zones, and different naming conventions for surcharges. Normalizing this information creates a single, reliable data structure that allows for fair comparisons.
Why normalization is key
Normalization often relies on an ETL workflow that cleans and restructures data so each carrier’s formats, terms, and codes can be compared fairly.
With normalized data, you can compare a carrier’s two-day service to another carrier’s equivalent service without worrying about mismatched terms or inconsistent formatting. This also makes it easier to review trends over time, catch billing errors, and model the impact of future rate changes.
ShipWise Intelligence automates this process, giving teams a clean dataset that’s ready for analysis, without hours spent preparing spreadsheets.
Identifying trends that improve shipping cost and performance
Once data is organized, you can begin to see the factors that shape your shipping costs and outcomes. One of the first places most teams look is delivery performance. Comparing promised delivery times with actual arrival dates helps spot underperforming lanes and services.
Sometimes this reveals that a premium service isn’t delivering the reliability you expect. Other times, it shows that a less expensive option delivers just as quickly. Analytics also helps with anomaly detection, flagging unusual spikes in cost, unexpected shipping delays, or patterns that fall outside normal performance.
Surcharge patterns that increase cost
Surcharges offer another area for quick wins. Address corrections, residential fees, and oversize charges often creep up over time. A close look at surcharge patterns can reveal process issues that are easy to fix, like improving address validation settings or adjusting how items are packaged.
Packaging and DIM weight insights
Packaging data also plays a role in reducing cost. When DIM weight drives up spend, reviewing your most common order combinations may show opportunities to refine your packing rules or introduce a more efficient cartonization setup. Each small improvement in packaging or routing can reduce cost without hurting delivery speed.
How trends support stronger carrier negotiations
These insights also give you stronger leverage in carrier contract negotiations. When you can benchmark carriers on cost, transit time, and reliability, with clear data showing where each one underperforms, it becomes easier to negotiate rates and service commitments with confidence.
Focusing on the metrics that matter most
With so many possible metrics to track, it’s helpful to divide them into a simple review cycle.
Daily metrics keep you aware of issues that need immediate attention, such as delayed or at-risk shipments. Weekly reviews show whether certain surcharges, lanes, or services are trending in the wrong direction.
Monthly reviews give a broader picture of network health, including cost per order, carrier mix, on-time performance, and the total impact of surcharges on your margin. They also make it easier to spot cost deviation and budget variance, helping you see where actual charges drift away from expectations due to surcharges, service choices, or changes in carrier performance.
These recurring touchpoints give you a healthy balance between short-term visibility and long-term trend analysis. They also provide structure for cross-department communication, helping operations, warehouse staff, finance, and customer service stay aligned.
How shipping analytics shapes daily operations
Good analytics support every part of the shipping workflow. In the warehouse, dimensional and packaging insights help refine cartonization rules so the right box is chosen more consistently. This reduces wasted space and helps avoid unnecessary DIM charges. In routing, carriers that consistently deliver on time in certain zones can be prioritized, while underperforming services can be removed from automation rules.
Finance teams depend on visibility into charges and discounts. Automated invoice audits can catch duplicate charges, missed discounts, and late deliveries that qualify for credits. Customer service teams benefit from early notice when shipments encounter delays, allowing them to contact customers before issues escalate.
ShipWise Intelligence ties these groups together by centralizing shipment, tracking, and cost data and by offering tools that surface insights automatically through dashboards and scheduled reports.
Real-time data improves 3PL billing cycles
For 3PLs, there’s an added benefit to having advanced shipping analytics: having accurate, real-time shipping data doesn’t just improve operations, it also improves cash flow. Many 3PLs bill clients monthly or even net-60 because they need time to reconcile carrier invoices, confirm charges, and sort out any errors. When this process is manual, long billing cycles become the only way to ensure accuracy.
With real-time, unified shipping data, that delay disappears. When shipment details, carrier costs, and surcharges are captured and verified as they happen, 3PLs can close out billing faster and more confidently. Instead of waiting for the full carrier invoice cycle, you can bill weekly, or even more frequently, because you already have the information you need to verify costs and pass them through.
Shorter billing cycles strengthen cash flow, reduce the risk of write-offs, and create more predictable revenue. For clients, it also provides clearer visibility into their spend and fewer surprises at the end of the month. That’s one of the reasons many 3PLs adopt a dedicated shipping analytics platform - it gives them both operational clarity and financial accuracy without added administrative work.
Looking ahead with predictive insights
Historical shipping data is useful not only for reviewing past performance but also for anticipating future challenges. Predictive analytics can highlight seasonal slowdowns, forecast volume spikes, and estimate how new carrier rates will affect your budget. These insights help you prepare routing strategies, adjust packaging rules, or redistribute volume before problems arise.
Predictive analytics can also help with GRI forecasting analysis, allowing you to estimate how annual rate increases will impact future spend across services, zones, and package profiles. This shift from reacting to issues toward planning becomes more important as shipping volume grows and delivery expectations rise.
Common blind spots to watch for
Even well-run operations often overlook trends that slowly affect cost and performance. Many businesses continue using faster services even when Ground already meets the same delivery timeframe.
Others might not realize how much surcharges grow month-over-month. And without consistent tracking, late deliveries may go unclaimed even when your contract allows for refunds. These blind spots aren’t always obvious without a structured view of data.
How shipping analytics tools help you move faster
Trying to manage everything manually through portals and spreadsheets becomes challenging as your shipping volume increases. Modern shipping analytics tools automate data collection, normalization, and reporting so teams can focus on decisions rather than data cleanup or maintaining internal tools.
ShipWise Intelligence provides these capabilities, helping shippers uncover hidden savings, audit invoices, and monitor performance without building a system from scratch.
A practical way to begin your shipping analysis
A simple review of your recent shipments is an easy first step. Look at your last month of invoices, identify your most common surcharges, and compare promised delivery dates to actual results for your main services. You’ll likely find several opportunities for improvement.
From there, a consistent review cycle, including daily, weekly, and monthly checks, keeps performance trending in the right direction and supports any updates you make to routing rules, packing logic, or carrier allocation.
Conclusion
Shipping data analytics makes it easier to understand how your network performs and identify areas for improvement. By connecting what you shipped, what you paid, and how well it was delivered, you gain clearer control over your costs and customer experience.
With the right tools and processes, every shipment becomes an opportunity to learn and refine your strategy. That’s the value of modern shipping analytics, and why more shippers are using it to build stronger, more reliable operations.


.svg)
.svg)
.svg)


.avif)
.avif)